

Allow HTML#
Since v2.4.0, the HTML content in your tables is escaped by default. You can change this by passing allow_html=True.
Warning
Please make sure that you trust the content of your tables before allowing HTML content. When allow_html=True, ITables passes the table content verbatim to datatables.net, and the HTML will be executed.
If you did not produce the non-numeric content yourself, you should sanitize it using e.g. rh3 or bleach.
See also this datatable page on security.
Text formatting#
When you allow HTML content, you can have formatted text, links or even images in your tables:
import pandas as pd

import itables

itables.init_notebook_mode()

itables.show(
    pd.Series(
        [
            "<b>bold</b>",
            "<i>italic</i>",
            '<a href="https://github.com/mwouts/itables">link</a>',
        ],
        name="HTML",
    ),
    allow_html=True,
)
Images in a table#
df = itables.sample_dfs.get_countries()

df["flag"] = [
    '<a href="https://flagpedia.net/{code}">'
    '<img src="https://flagpedia.net/data/flags/h80/{code}.webp" '
    'alt="Flag of {country}"></a>'.format(code=code.lower(), country=country)
    for code, country in zip(df.index, df["country"])
]
df["country"] = [
    '<a href="https://en.wikipedia.org/wiki/{}">{}</a>'.format(country, country)
    for country in df["country"]
]
df["capital"] = [
    '<a href="https://en.wikipedia.org/wiki/{}">{}</a>'.format(capital, capital)
    for capital in df["capital"]
]
itables.show(df, allow_html=True)
Loading ITables v3.0.0.dev0 from the init_notebook_mode cell...
(need help?)
|
| ⓘ | region | country | capital | longitude | latitude | flag |
|---|---|---|---|---|---|---|
| code | ||||||
| AW | Latin America & Caribbean | Aruba | Oranjestad | -70.016700 | 12.516700 |  |
| AF | South Asia | Afghanistan | Kabul | 69.176100 | 34.522800 |  |
| AO | Sub-Saharan Africa | Angola | Luanda | 13.242000 | -8.811550 |  |
| AL | Europe & Central Asia | Albania | Tirane | 19.817200 | 41.331700 |  |
| AD | Europe & Central Asia | Andorra | Andorra la Vella | 1.521800 | 42.507500 |  |
| AE | Middle East & North Africa | United Arab Emirates | Abu Dhabi | 54.370500 | 24.476400 |  |
| AR | Latin America & Caribbean | Argentina | Buenos Aires | -58.417300 | -34.611800 |  |
| AM | Europe & Central Asia | Armenia | Yerevan | 44.509000 | 40.159600 |  |
| AS | East Asia & Pacific | American Samoa | Pago Pago | -170.691000 | -14.284600 |  |
| AG | Latin America & Caribbean | Antigua and Barbuda | Saint John's | -61.845600 | 17.117500 |  |
| (198 more rows not shown) | ||||||
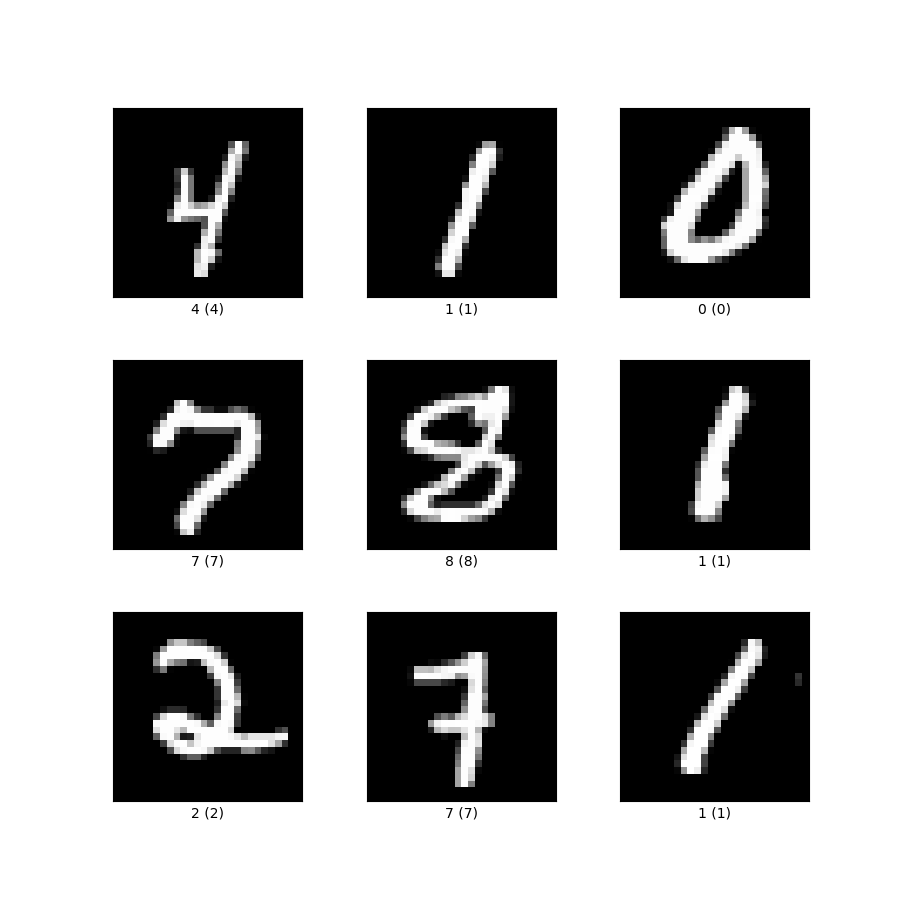
Base64 images#
Base64 encoded image are supported, too:
itables.show(
    pd.Series(
        {
            "url": '<img src="https://storage.googleapis.com/tfds-data/visualization/fig/mnist-3.0.1.png" height="50" alt="MNIST">',
            "base64": '<img src="data:image/png;base64, iVBORw0KGgoAAAANSUhEUgAAAAUA'
            "AAAFCAYAAACNbyblAAAAHElEQVQI12P4//8/w38GIAXDIBKE0DHxgljNBAAO"
            '9TXL0Y4OHwAAAABJRU5ErkJggg==" alt="Red dot">',
        },
        name="Images",
    ),
    allow_html=True,
)